Fully Customizable. API Integration.
4 best free Google Analytics plugins for WordPress in 2017
 Regardless of the type of website you run, in order to be better, you need to know how your audience engages with your content. This is where Google Analytics can help.
The Google Analytics suite is the most popular analytics tool on the web for several reasons.
It’s available for free from Google and just like any other of their free tools, it offers a polish and functionality that put many paid solutions to shame.
The main function of Google Analytics is to track what your visitors do on your websites – which links they visit, which buttons they click, on which page they land, from which page they leave, how long they stay on each page.
As you can imagine, this information is invaluable for any website owner, as you learn which items on your website are more interesting, which naturally attract attention and where you need to improve.
In short, having access to this information and analyzing it will help you to increase the popularity of your site.
And today, we will show the best free Google Analytics plugins for WordPress.
Best free Google Analytics plugins
One thing you need to remember before you go installing any one of these plugins is that you need to have an active Google Analytics profile with a tracking code installed on your website.
Google Analytics for WordPress by MonsterInsights

The Google Analytics from MonsterInsights is one of the most popular plugins out there.
As it is today, the plugin offers a free version, that is severely lacking in functionality, and a premium version, that offers a lot more in terms of information.
However, even though it lacks a lot in terms of functions – for example, you can specify a date range for which to see statistical data – what it does it does beautifully.
It allows you see the session data for the last 7 days in a nice graph, as well as the top traffic and referral sources.
All in all – it won’t replace a deep dive in the trove of information that is available in Google Analytics.
Yet, it’s perfectly adequate if you want just a quick glance to see how your website has been doing in the last few days.
Google Analytics Dashboard for WP (GADWP)
The Google Analytics Dashboard for WP (or just GADWP) is just what the title says – a dashboard add-on, that will show you stats for your website from Google Analytics.
However, albeit its simple appearance, this plugin pulls a surprisingly large amount of different stats.
You can view information on sessions, users, organic search, page views, bounce rate, location, pages, referrers, searches, traffic, technology and 404 errors
And not only that, it can show both historical data up to three years past as well as real-time statistics about what is going on with your website.
The only downside is that all of this is crammed into a small box in the dashboard page.
Due to the restricted space it occupies, this plugin will only show you data about one aspect of your website.
For example, you can see information about the technology and the bounce rate.
Google Analytics Dashboard Plugin for WordPress
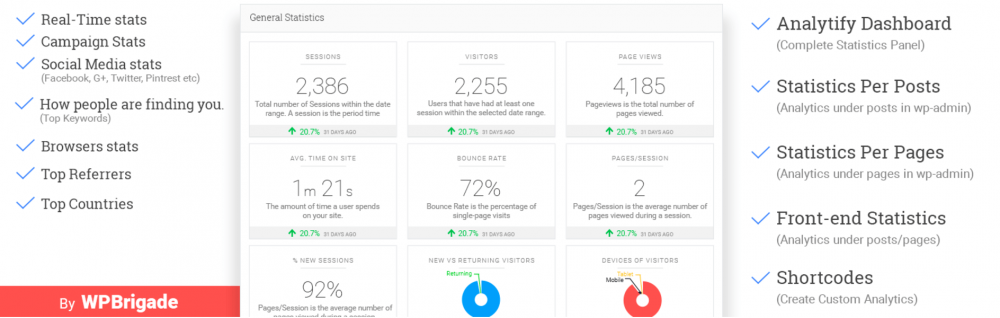
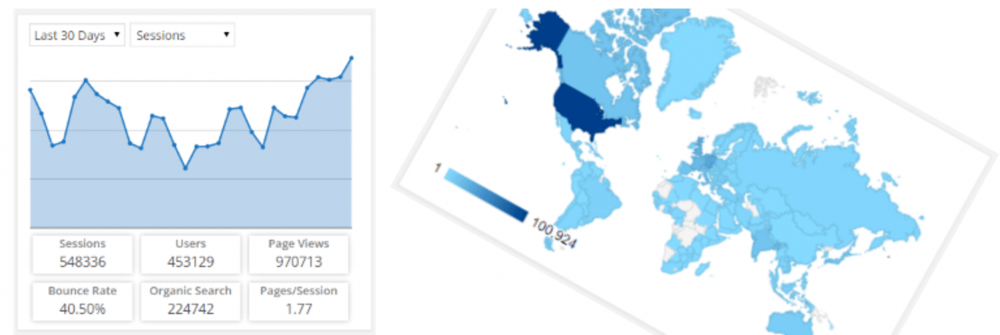
The Google Analytics Dashboard Plugin for WordPress by Analytify is our personal recommendation for a Google Analytics plugin.
It has its own dedicated menu in the WordPress admin, where you can see a plethora of useful information.
Right on top, you will see a collection of general stats – sessions, visitors, page views, bounce rates, etc., each one in its own box, which allows you to see all of them at once.
Below then, you will find a list of the top pages for your websites, based on the number of views. You will also see a world map which will show you from where your visitors come.
You can also see a detailed information about the OS and the browser your visitors use, top keywords, regular and social media referrers and a quick summary of what visitors do when they land on your site.
And you can change the time period to anything from the last 24 hours to one year ago.
Google Analytics

The Google Analytics plugin will create both a dashboard widget and a separate menu section so that you can have both a quick glance at your stats as well as a deeper dive.
In the dashboard widget, you will find detailed information about page views, visits, users, organic search, and bounce rate. You can also switch the period for these stats from 7 to up to 90 days in the past.
Surprisingly, the dedicated menu section offers pretty much the same information, but only for the past 7 days, which are in turn compared with the previous 7 days. In addition, there you can also find if a piece of content on your website is trending.
However, for this feature to work, you need to have a fair amount of visitors, as well as a really popular piece of content.
How do I read the Google Analytics Reports?
Your Google Analytics reports can help you improve your search engine ranking and boost your website traffic if you know how to read and analyze them.
Here is a quick explanation of what the metrics in the default Google Analytics report represent:
- Sessions – The total number of times a given visitor goes to your website or requests your URL. However, one visitor can open multiple sessions, so don’t confuse them with unique visitors. Each session will expire either after 30 minutes of inactivity or at end of the day.
- Users – Once called ‘Unique Visitors’, this metric represents the number of visitors that have had at least one session on your website. A visitor who has had multiple sessions will still be counted as one visitor.
- Pageviews – The total number of pages your visitors have viewed during the specified time period. Keep in mind that this metric does not represent the number of unique pageviews. Repeated views, even from one and the same user, are still counted here.
- Pages per Session – The average number of pages a user visits during one session. If a user visits a single page multiple times during the same session, this is reflected here as well. A higher number indicates a more engaging website.
- Average Session Duration – This metric represents the average length of a visitor’s session. Longer sessions indicate more engaged visitors.
- Bounce Rate – Bounce rate refers to the percentage of users who visit just one page and then leave. Usually, if a page has a high bounce rate, this means that its content has failed to engage those visiting it. The lower this number is, the better. Average bounce rates tend to be between 40% and 60%. Higher bounce rates can be expected from single-page websites, login pages, landing pages with a signup form, news article pages, etc.
- Percent of New Sessions – This metric represents the percentage of first-time visitors to your website. The higher this number is, the better – if the site is new. However, if it’s old, this might mean a lack of repeat visits. This metric also depends on the type of website. For example, if you have a dedicated client area, your existing customers will have little interest in visiting, say, the front page of your site all too often.
If you wish to know more about Google Analytics and how to take advantage of all of the functions available there, you can check the free Google Analytics for Beginners course from Google.
Leave a Reply